Province or territory | Population | Percentage of national pop. | Total area (km2) | Population density | Seats in House of Commons | People per House Seat |
|---|---|---|---|---|---|---|
| Ontario | 13,119,251 | 38.73% | 1,076,395 | 12.19 | 106 | 123,767 |
| Quebec | 7,856,881 | 23.19% | 1,365,128 | 5.76 | 75 | 104,758 |
| British Columbia | 4,479,934 | 13.23% | 925,186 | 4.84 | 36 | 124,443 |
| Alberta | 3,703,979 | 10.93% | 642,317 | 5.77 | 28 | 132,285 |
| Manitoba | 1,226,196 | 3.62% | 553,556 | 2.22 | 14 | 87,585 |
| Saskatchewan | 1,034,974 | 3.06% | 591,670 | 1.75 | 14 | 73,927 |
| Nova Scotia | 940,397 | 2.78% | 53,338 | 17.63 | 11 | 85,491 |
| New Brunswick | 750,457 | 2.22% | 71,450 | 10.50 | 10 | 75,046 |
| Newfoundland and Labrador | 510,272 | 1.51% | 373,872 | 1.36 | 7 | 72,896 |
| Prince Edward Island | 141,374 | 0.42% | 5,660 | 24.98 | 4 | 35,344 |
| Northwest Territories | 43,244 | 0.13% | 1,183,085 | 0.037 | 1 | 43,244 |
| Yukon | 33,963 | 0.10% | 474,391 | 0.072 | 1 | 33,963 |
| Nunavut | 32,435 | 0.10% | 1,936,113 | 0.017 | 1 | 32,435 |
| Canada | 33,873,357 |
Canada (
In 1867, with the union of three British North American colonies throughConfederation, Canada was formed as a federal dominion of four provinces. This began an accretion of provinces and territories and a process of increasing autonomy from the United Kingdom. This widening autonomy was highlighted by the Statute of Westminster 1931 and culminated in the Canada Act 1982, which severed the vestiges of legal dependence on the British parliament.
It is a member of the G7, G8, G20, NATO, OECD, WTO, Commonwealth of Nations,Francophonie, OAS, APEC, and UN. With the eighth-highest Human Development Index globally, it has one of the highest standards of living in the world.

Largest Metropolitan Areas:
| Largest metropolitan areas in Canada by population (2006 Census) | ||||||
|---|---|---|---|---|---|---|
| Name | Province | Pop. | Name | Province | Pop. | |
| Toronto | Ontario | 5,113,149 | Kitchener–Cambridge-Waterloo | Ontario | 451,235 | |
| Montreal | Quebec | 3,635,571 | St. Catharines–Niagara | Ontario | 390,317 | |
| Vancouver | British Columbia | 2,116,581 | Halifax | Nova Scotia | 372,858 | |
| Ottawa–Gatineau | Ontario–Quebec | 1,130,761 | Oshawa | Ontario | 330,594 | |
| Calgary | Alberta | 1,079,310 | Victoria | British Columbia | 330,088 | |
| Edmonton | Alberta | 1,034,945 | Windsor | Ontario | 323,342 | |
| Quebec | Quebec | 715,515 | Saskatoon | Saskatchewan | 233,923 | |
| Winnipeg | Manitoba | 694,898 | Regina | Saskatchewan | 194,971 | |
| Hamilton | Ontario | 692,911 | Sherbrooke | Quebec | 186,952 | |
| London | Ontario | 457,720 | St. John's | Newfoundland and Labrador | 181,113 | |

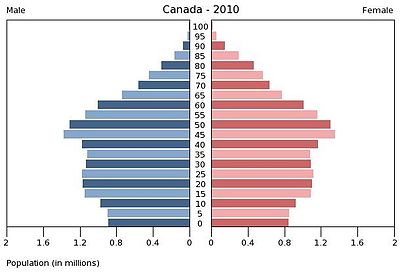
total: 39.5 years
- male: 38.6 years
- female: 40.4 years (2006)
Vital statistics
Birth rate: 10.28 births/1,000 population (2009 est.)
Death rate: 7.74 deaths/1,000 population (2009 est.)
Net migration rate: 5.63 migrant(s)/1,000 population (2009 est.)
Projected Population:
United Nations, 2010 est. [2] :
- 2020: 37,163,000
- 2030: 39,850,000
- 2040: 41,882,000
- 2050: 43,642,000
- 2060: 45,101,000
- 2070: 46,271,000
- 2080: 47,206,000
- 2090: 47,906,000
- 2100: 48,290,000
Aboriginal status
The 2006 census counted a total Canadian Aboriginal population of 1,172,790 (3.75%) which includes 698,025 First Nations (2.23%), 389,785 Métis (1.25%), and 50,480 Inuit (0.16%). Percentages are calculated as a proportion of the total number of respondents (31,241,030)[13]
Province/Territory | Number | % provincial[14]  | % national[14]  | Indian ,(First Nations)  | Métis | Inuit | Multiple [14] | Other[14] |
|---|---|---|---|---|---|---|---|---|
| Nunavut | 24,915 | 85.0% | 2.1% | 100 | 125 | 24,640 | 30 | 20 |
| Northwest Territories | 20,635 | 50.3% | 1.8% | 12,640 | 3,580 | 4,160 | 105 | 145 |
| Yukon | 7,580 | 25.1% | 0.6% | 6,275 | 800 | 255 | 50 | 190 |
| Manitoba | 175,395 | 15.5% | 15.0% | 100,645 | 71,805 | 565 | 680 | 1,695 |
| Saskatchewan | 141,890 | 14.9% | 12.1% | 91,400 | 48,115 | 220 | 625 | 1,530 |
| Alberta | 188,365 | 5.8% | 16.1% | 97,280 | 85,495 | 1,605 | 1,220 | 2,760 |
| British Columbia | 196,075 | 4.8% | 16.7% | 129,575 | 59,445 | 795 | 1,655 | 4,605 |
| Newfoundland and Labrador | 23,450 | 4.7% | 2.0% | 7,765 | 6,470 | 4,715 | 290 | 4,205 |
| Canada | 1,172,790 | 3.8% | 100.0% | 698,025 | 389,785 | 50,480 | 7,740 | 26,760 |
| Nova Scotia | 24,175 | 2.7% | 2.1% | 15,240 | 7,680 | 320 | 100 | 830 |
| New Brunswick | 17,655 | 2.5% | 1.5% | 12,385 | 4,270 | 185 | 100 | 710 |
| Ontario | 242,495 | 2.0% | 20.7% | 158,400 | 73,610 | 2,040 | 1,910 | 6,540 |
| Quebec | 108,430 | 1.5% | 9.2% | 65,085 | 27,980 | 10,950 | 955 | 3,450 |
| Prince Edward Island | 1,730 | 1.3% | 0.1% | 1,230 | 385 | 30 | 10 | 75 |
| Sources: 2006 Census[15][16][ 17 | ||||||||
Full article: http://en.wikipedia.org/wiki/Demographics_of_Canada